Validation and limitations
We compared our simulations with two published impedance-tube measurements. Each case was simulated from geometry alone, with no parameters fitted to the measured data.
Case A: micro-perforated panel with 5, 10 and 15 mm air gaps
Measured data traced from Fig. 9 of Sekar, V., Eh Noum, S. Y., Putra, A., Sivanesan, S., Chin, K. C., Wong, Y. S., & Kassim, D. H. (2021). Acoustic properties of micro-perforated panels made from oil palm empty fruit bunch fiber reinforced polylactic acid. Sound & Vibration, 55(4), 343–352. https://doi.org/10.32604/sv.2021.014916 (CC BY 4.0).
| Air gap | f peak, simulation | f peak, measurement | Δf | α peak, sim / exp |
|---|---|---|---|---|
| 5 mm | 2610 Hz | 2720 Hz | −4.1 % | 1.00 / 0.99 |
| 10 mm | 1800 Hz | 1900 Hz | −5.2 % | 1.00 / 0.99 |
| 15 mm | 1485 Hz | 1575 Hz | −5.7 % | 0.99 / 0.98 |
The simulation reproduces the peak absorption, the shape of each curve, and the shift of the peak to lower frequency as the air gap grows. The measured peaks sit 90–115 Hz (about 5%) higher in frequency, a consistent offset across all three gaps. The simulation was solved in 45 Hz steps.
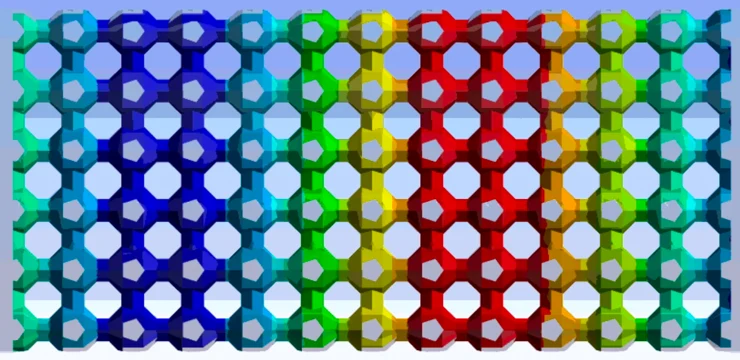
Case B: 3D-printed periodic lattice (OPC-5) with a 40 mm air gap
Measured data traced from Fig. 12(b) of Zieliński, T. G., Opiela, K. C., Pawłowski, P., Dauchez, N., Boutin, T., Kennedy, J., … Groby, J. P. (2020). Reproducibility of sound-absorbing periodic porous materials using additive manufacturing technologies: Round robin study. Additive Manufacturing, 36, 101564. https://doi.org/10.1016/j.addma.2020.101564. The sample has a 5 mm periodic cell and is 60 mm thick.
| Peak | f, simulation | f, measurement | Δf | α, sim / exp |
|---|---|---|---|---|
| 2nd | 2040 Hz | 1970 Hz | +3.6 % | 0.87 / 0.84 |
| 3rd | 3720 Hz | 3675 Hz | +1.2 % | 0.94 / 0.91 |
| 4th | 4620 Hz | 4665 Hz | −1.0 % | 0.98 / 0.96 |
The comparison covers 800–6000 Hz; the traced measurement below about 800 Hz was not reliable enough to compare. The simulation was solved in 60 Hz steps.
Interactive charts for both cases are on the homepage.
How our model replicates the test
A replica of the test, not just a unit cell. Many published simulations model a single periodic cell in an idealised duct. We model the complete sample inside a circular tube at the specimen's actual diameter, with the tube lengths of the physical setup and the fit between sample and tube wall resolved down to sub-micrometre clearances, often what decides whether a simulation matches a measurement.
Fine pores and complex lattices. High-resolution meshing of narrow channels and thin TPMS walls directly from STL, including the convergence checks needed to trust the result.
Sample fit, quantified. We have measured, numerically, how gaps of 0.1–1 mm around the sample shift the absorption curve, so we can tell you how sensitive your design is to how it is mounted.
Modelling and printing accuracy in the literature
- Zieliński, T. G., Venegas, R., Perrot, C., Červenka, M., Chevillotte, F., & Attenborough, K. (2020). Benchmarks for microstructure-based modelling of sound absorbing rigid-frame porous media. Journal of Sound and Vibration. doi:10.1016/j.jsv.2020.115441
Provides benchmark cases for modelling porous media from their periodic microstructure, cross-verifying multiscale methods against direct simulations of the linearised Navier–Stokes–Fourier equations. - Boulvert, J., Costa-Baptista, J., Cavalieri, T., Perna, M., Fotsing, E., Romero-García, V., … Groby, J.-P. (2020). Acoustic modeling of micro-lattices obtained by additive manufacturing. Applied Acoustics, 164, 107244. doi:10.1016/j.apacoust.2020.107244
Found that fused-deposition printing introduces filament shape, shrinkage and surface-roughness defects, and that ignoring them can underestimate the absorption coefficient by about 0.1. - Zieliński, T. G., et al. (2020). Reproducibility of sound-absorbing periodic porous materials using additive manufacturing technologies: Round robin study. Additive Manufacturing, 36, 101564. doi:10.1016/j.addma.2020.101564
Identified manufacturing quality and the fit of the sample in the impedance tube as the main sources of discrepancy between measurements of nominally identical printed samples.
Limitations
- Not an accredited measurement. The results simulate the ISO 10534-2 and ASTM E2611 test configurations. They do not replace an accredited laboratory report for certification or compliance.
- Normal incidence only. Tube results, physical or numerical, are for normal incidence. They differ from random-incidence absorption measured in a reverberation room (ISO 354) and from building-acoustics sound reduction ratings.
- As designed, not as printed. The model uses your CAD geometry. Printed samples differ through surface roughness, trapped powder or resin, and dimensional tolerance, and these differences usually explain most of the gap between a model and a physical tube test. An as-printed tolerance study is available as a custom project.
- Geometry required. Foams and fibrous materials without a geometry file are outside the scope of this method.
- Flexible parts. If your design includes thin membranes or parts expected to vibrate, mention it in your brief so we can confirm the modelling approach before quoting.